事前準備
このチュートリアルでは、事前に以下のコマンドを使用してパッケージをインストールしてください。最終的な成果物
チュートリアル
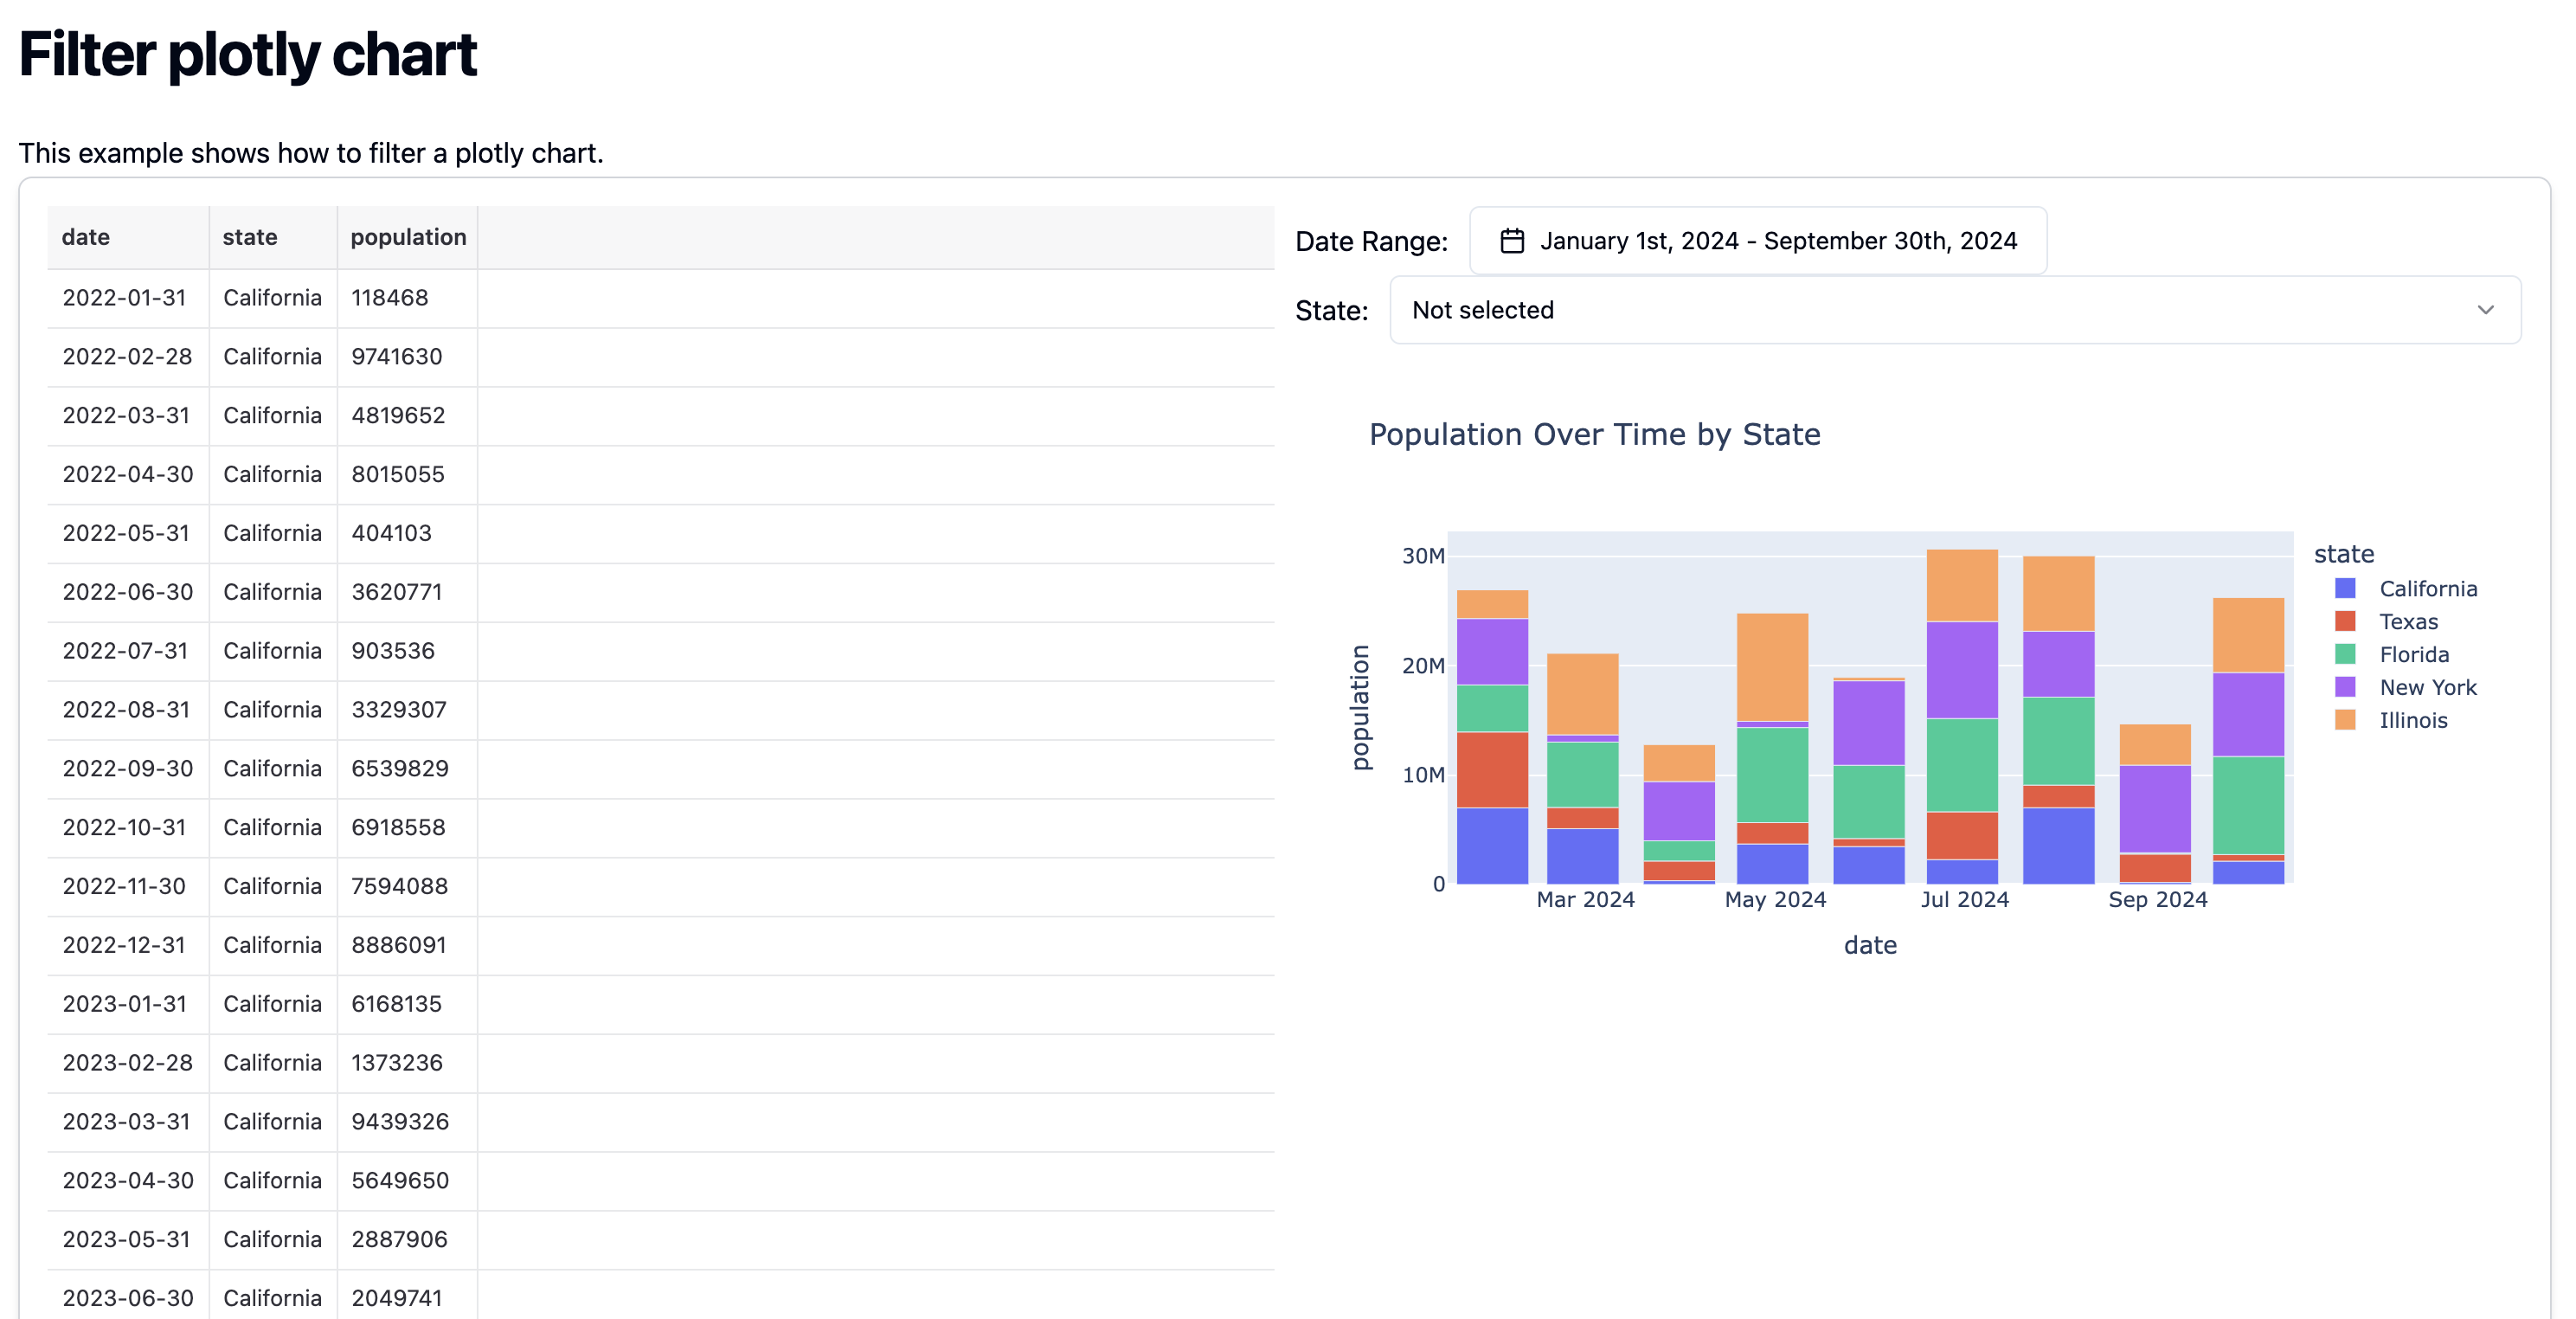
ユーザーの入力によって表示内容を切り替える動的なアプリケーションを作成するためには、MDXファイルで入力フォームを作成して、その値をPython関数に渡す必要があります。 Python関数ではcontext.varsを使用して入力フォームに入力された値を受け取り、返却するチャートのデータをフィルタリングします。
このチュートリアルでは、上記に加えて入力フォームの選択肢をSQLを使用して取得をする方法も紹介しています。
- 1. Python
- 2. SQL
- 3. MDX(pages)
ここでは、以下の2つの関数を作成しています。
generate_population_data: チュートリアルに使用するデータを生成しています。本番環境ではこの関数部分でデータを取得しすることができます。また、この関数はSQLファイルに代替することもできるため、SQLファイルでデータベースからデータを取得して使用することもできます。filter_plotly_chart:generate_population_dataで生成されたデータをフィルタリングして、Plotlyのチャートを返却する関数です。
<Embed />で使用できるように自動的にHTMLに変換をします。