Morph allows you to create data apps using visualization libraries within the Python ecosystem. In this tutorial, we will introduce how to embed a rich dashboard created with PyGWalker into a data app.

Prerequisites

Please install PyGWalker in advance by the following command.

pip install pygwalker

Output

PyGWalker is a library that creates a dashboard for interactive data analysis from data on a DataFrame. You can easily introduce a BI app by placing it on the data app created by Morph and sharing it with your team.
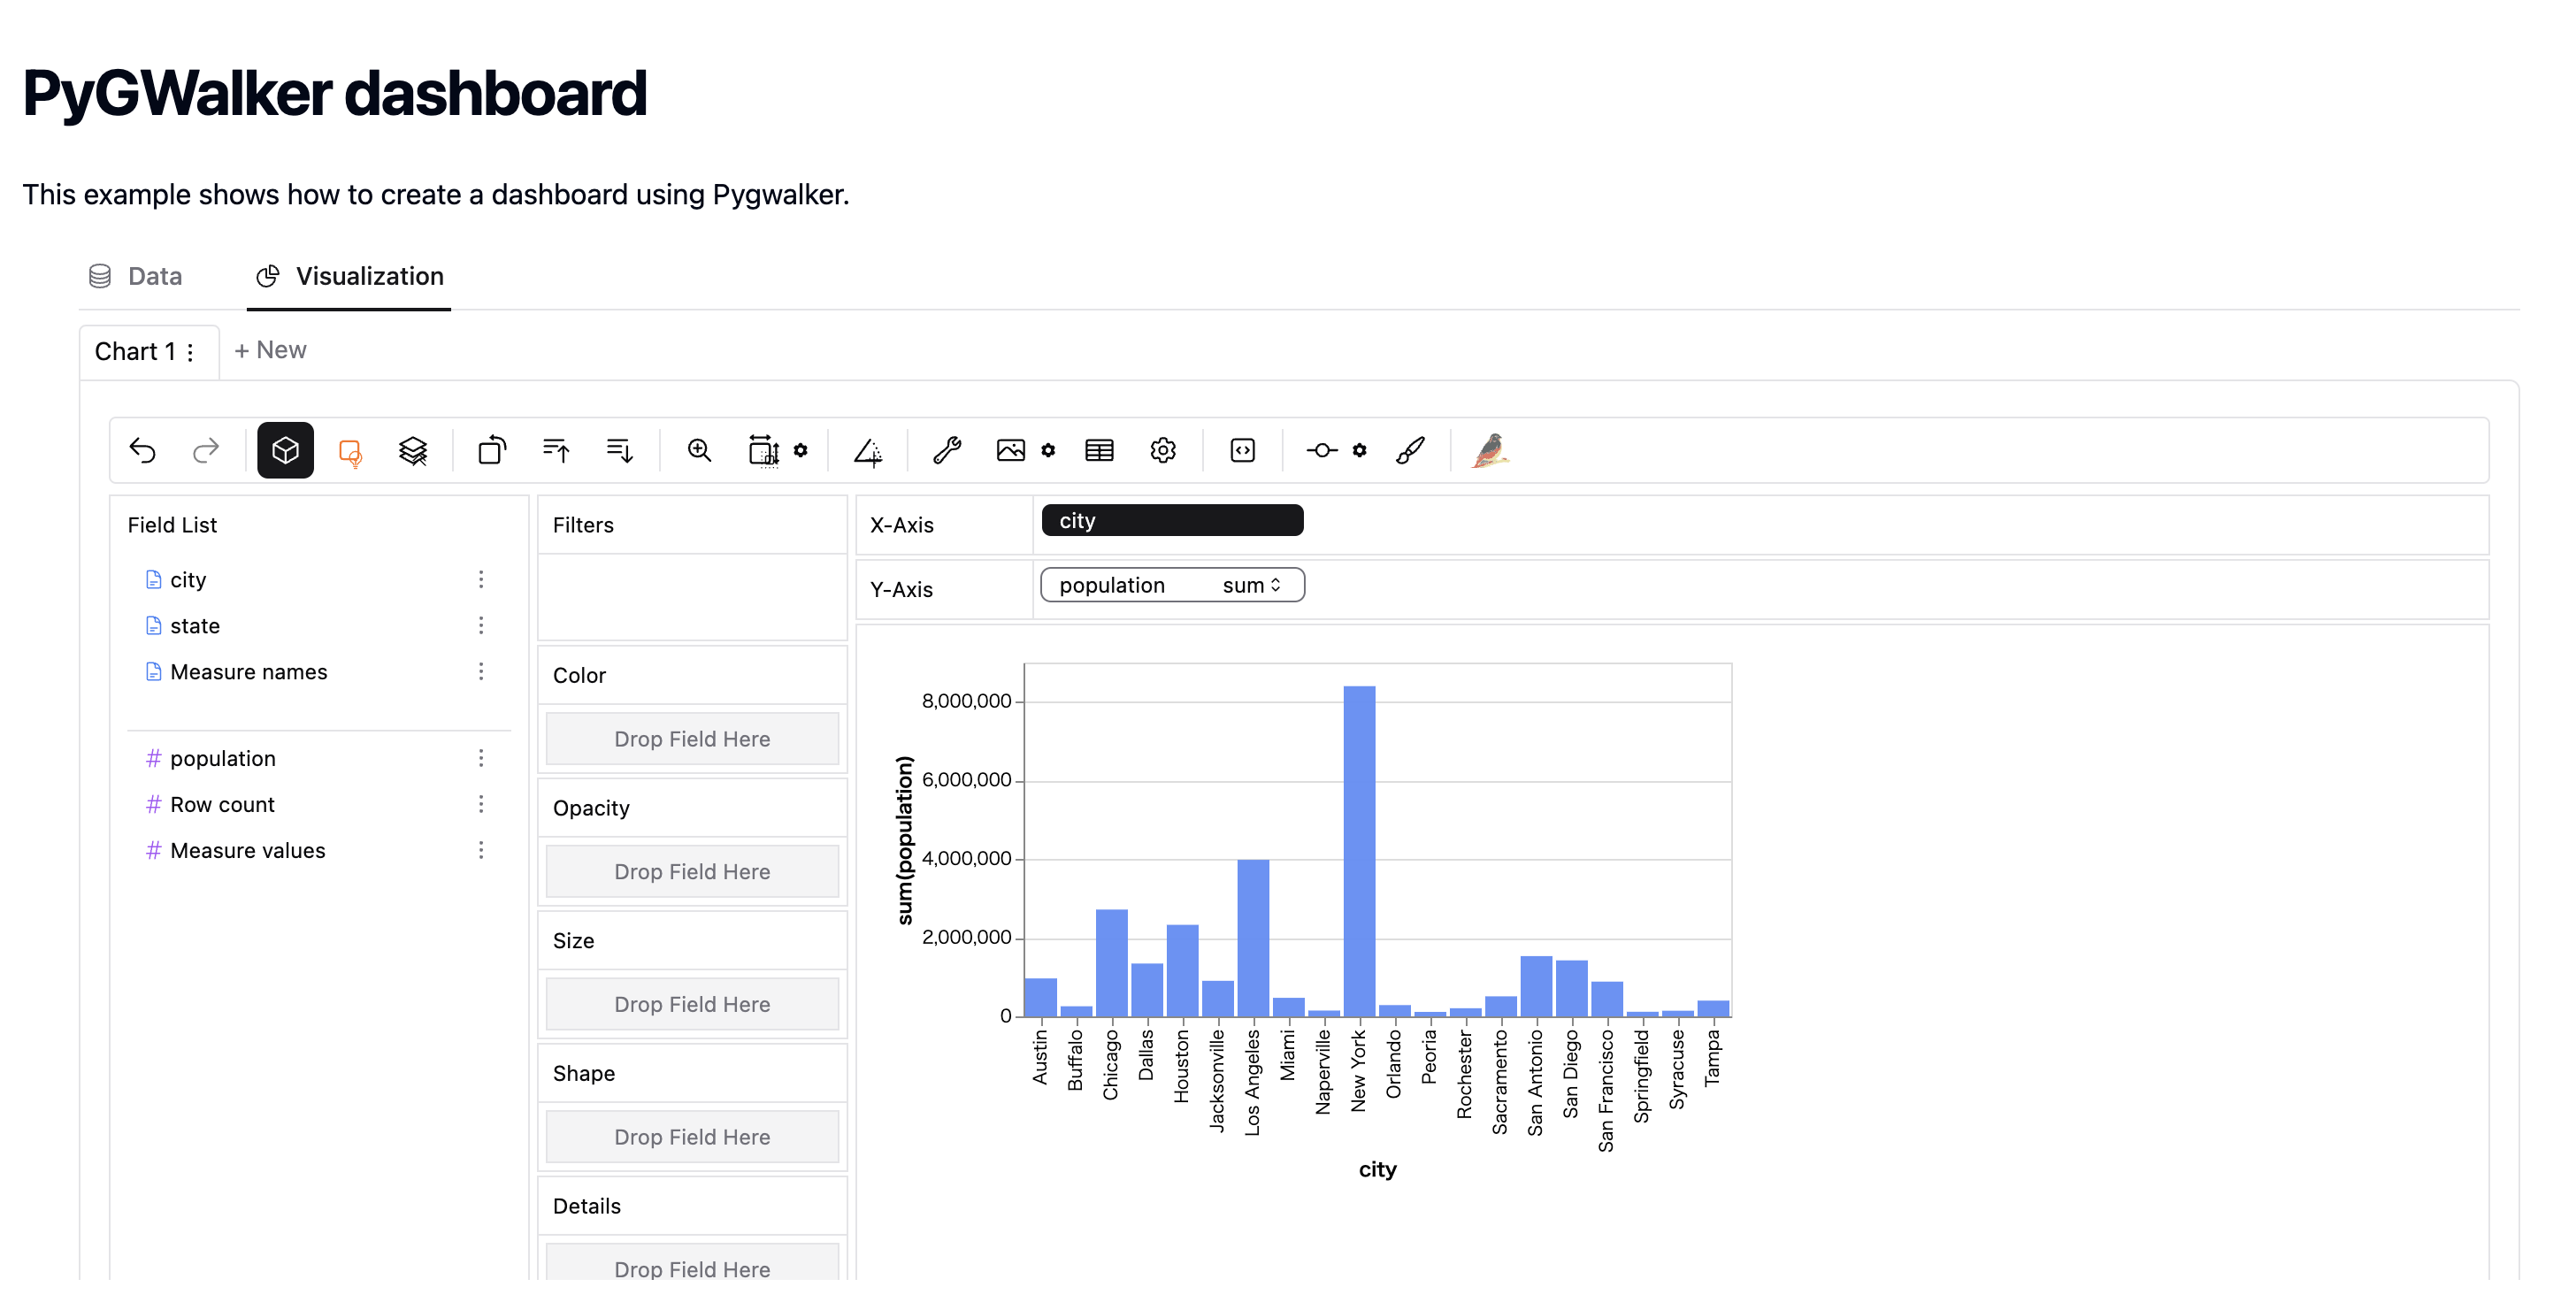
PyGWalker

Tutorial

In this tutorial, we will implement the app in the following steps:

  1. Create a Python function that returns HTML using PyGWalker.
  2. Pass the created Python function to the <Embed /> component in the MDX file to display the dashboard.

<Embed /> displays the HTML when a Python function that returns HTML is specified as the target of loadData.

Create sample data as a DataFrame, convert the data to a dashboard using PyGWalker, and return it as HTML.

import pandas as pd
import morph
from morph import MorphGlobalContext
from morph_lib.types import HtmlResponse
import pygwalker as pyg

@morph.func
def create_pygwalker_dashboard(context: MorphGlobalContext):
    data = pd.DataFrame({
        "city": [
            "Los Angeles", "San Francisco", "San Diego", "Sacramento",
            "Houston", "Dallas", "Austin", "San Antonio",
            "Miami", "Orlando", "Tampa", "Jacksonville",
            "New York", "Buffalo", "Rochester", "Syracuse",
            "Chicago", "Springfield", "Peoria", "Naperville"
        ],
        "state": [
            "California", "California", "California", "California",
            "Texas", "Texas", "Texas", "Texas",
            "Florida", "Florida", "Florida", "Florida",
            "New York", "New York", "New York", "New York",
            "Illinois", "Illinois", "Illinois", "Illinois"
        ],
        "population": [
            3980400, 883305, 1423851, 508529,
            2328000, 1343000, 964300, 1532200,
            470914, 285713, 399700, 903889,
            8399000, 256304, 206284, 142749,
            2716000, 116250, 112936, 147122
        ]
    })
    html_code = pyg.to_html(data, appearance="light")
    return HtmlResponse(html_code)