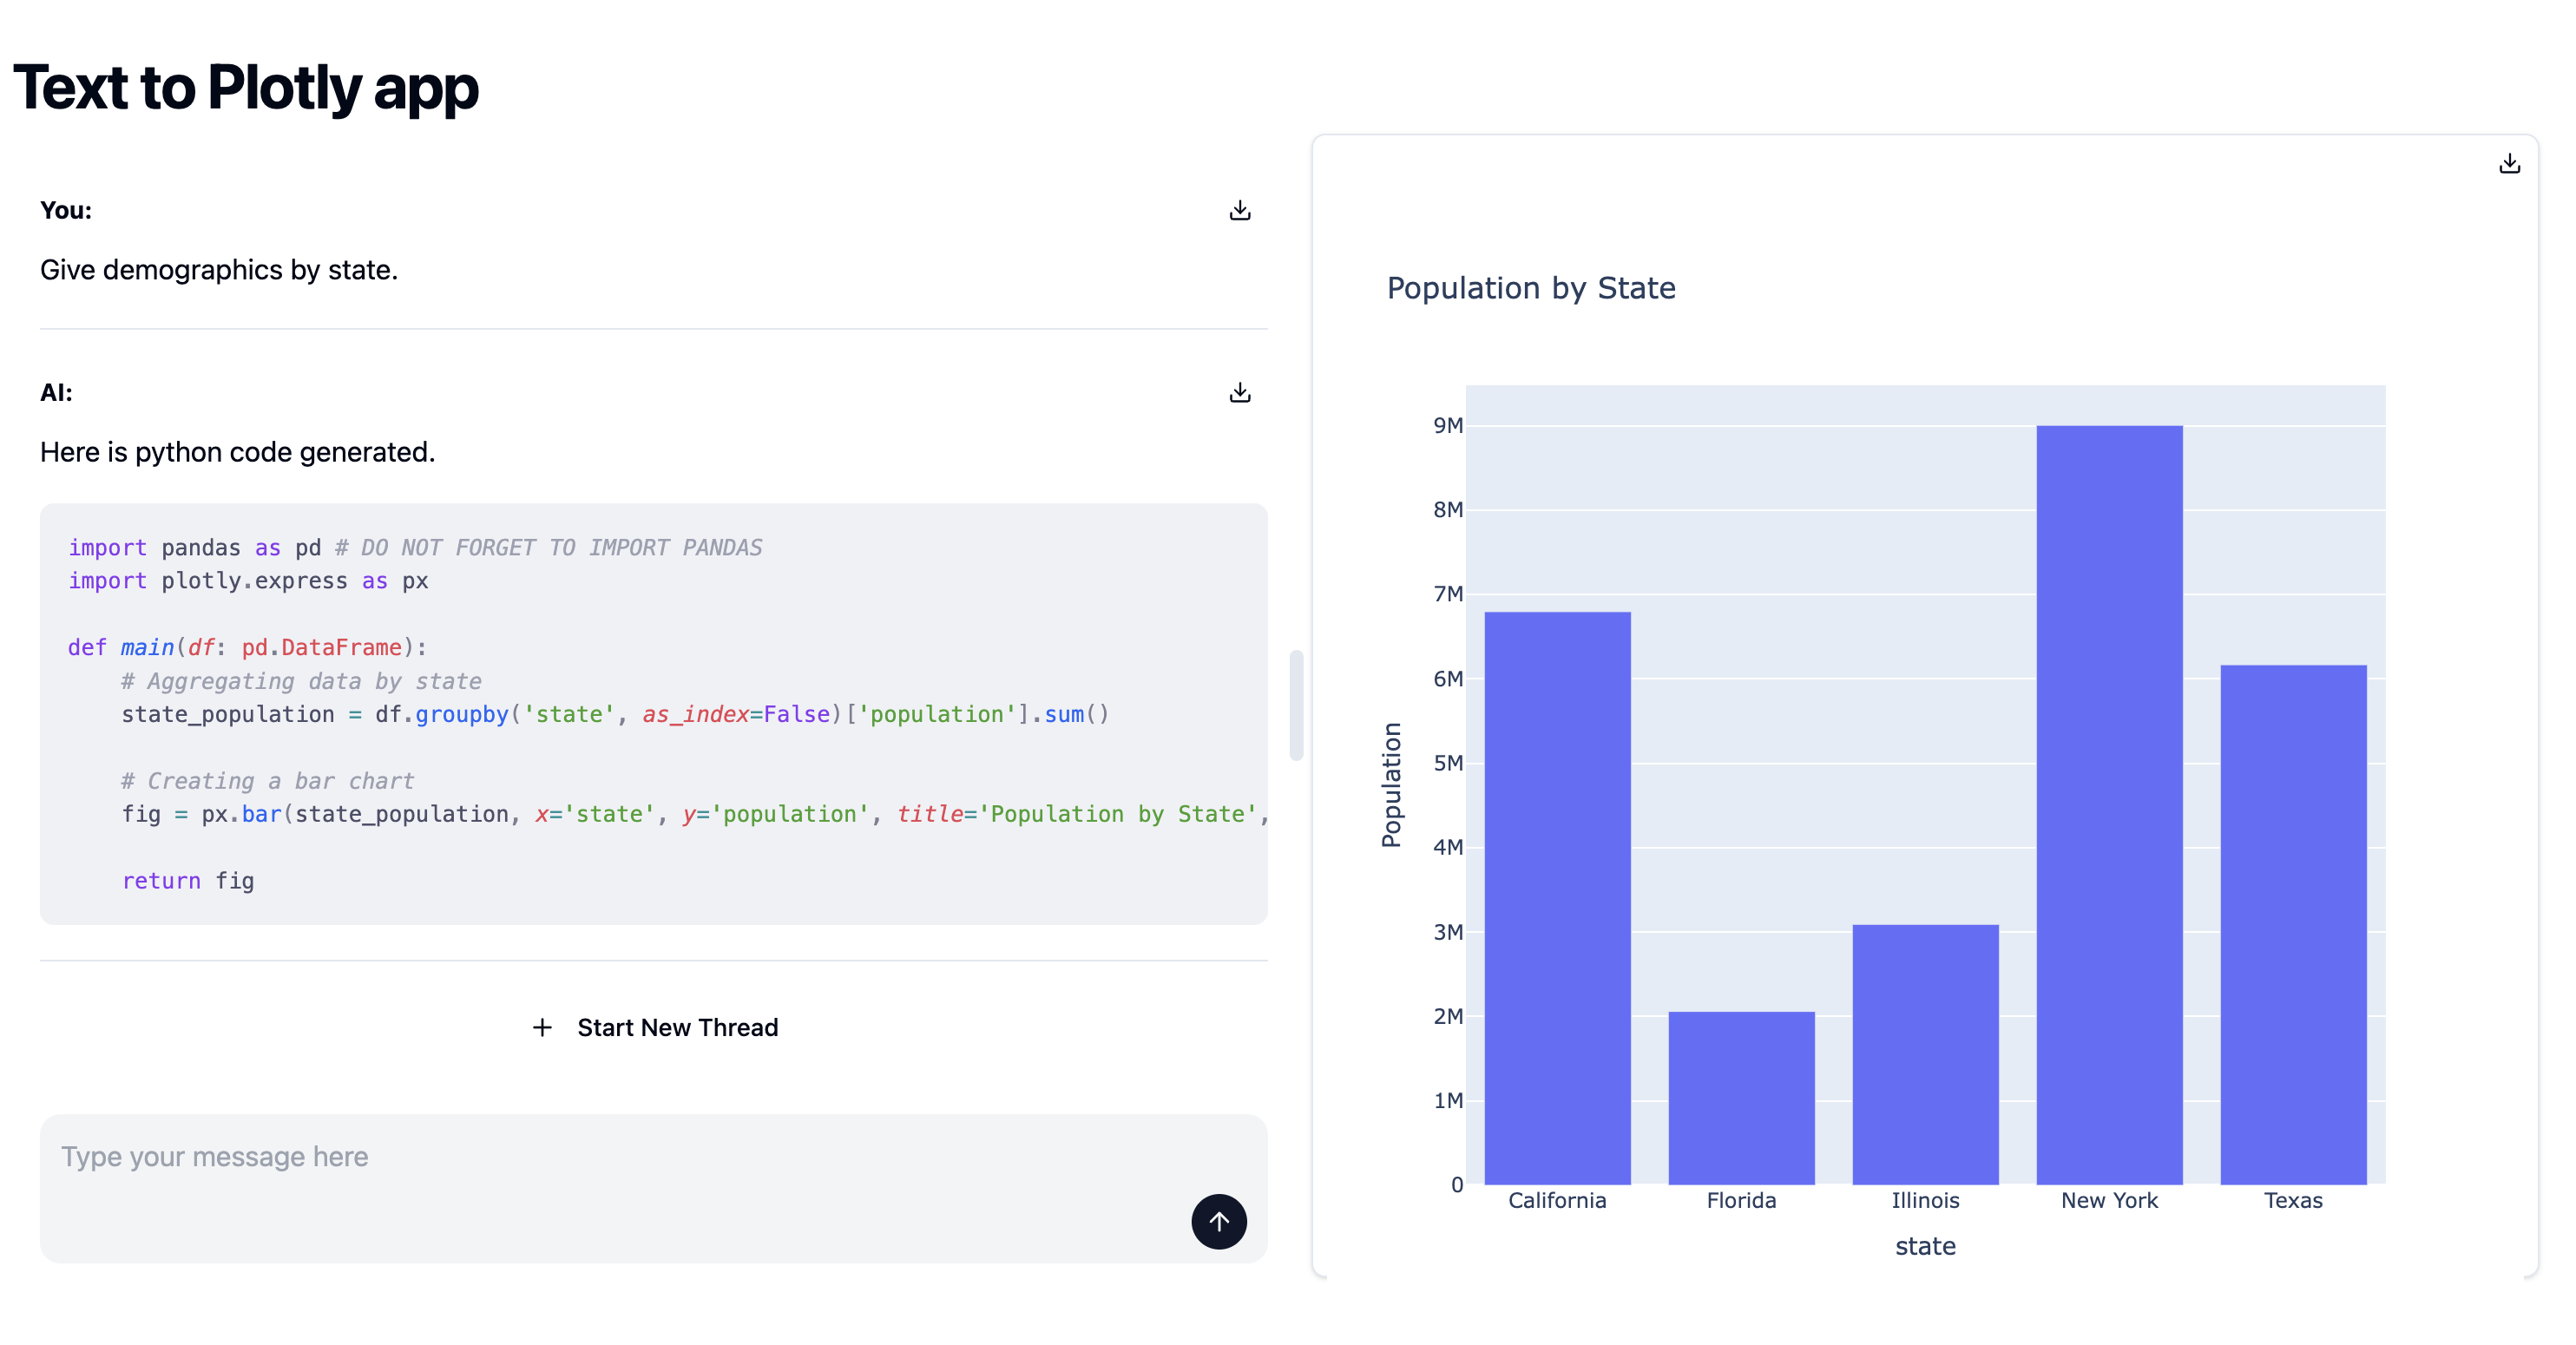
import json
import pandas as pd
import os
import morph
from openai import OpenAI
from morph import MorphGlobalContext
from morph_lib.stream import create_chunk

@morph.func
def text_to_plotly_app(context: MorphGlobalContext):
    df = pd.DataFrame({
        "city": [
            "Los Angeles", "San Francisco", "San Diego", "Sacramento",
            "Houston", "Dallas", "Austin", "San Antonio",
            "Miami", "Orlando", "Tampa", "Jacksonville",
            "New York", "Buffalo", "Rochester", "Syracuse",
            "Chicago", "Springfield", "Peoria", "Naperville"
        ],
        "state": [
            "California", "California", "California", "California",
            "Texas", "Texas", "Texas", "Texas",
            "Florida", "Florida", "Florida", "Florida",
            "New York", "New York", "New York", "New York",
            "Illinois", "Illinois", "Illinois", "Illinois"
        ],
        "population": [
            3980400, 883305, 1423851, 508529,
            2328000, 1343000, 964300, 1532200,
            470914, 285713, 399700, 903889,
            8399000, 256304, 206284, 142749,
            2716000, 116250, 112936, 147122
        ]
    })
    prompt = context.vars["prompt"]

    data = df.head(5).to_markdown()
    messages = [
        {
            "role": "system",
            "content": """You are a great data analyst using python.
You can generate python code based on user prompt and you can use given python libraries.
Please generate python code using plotly or matplotlib for visualization and pandas based on the user's question.
"""},
        {
            "role": "system",
            "content": f"""Generate Python code for visualization using pandas, plotly and you should follow user's question.
Make sure to write `import pandas as pd` at the beginning of the code otherwise the code must throw errors.

## Rules:
1. You must generate Python code using plotly for visualization and the code should return plotly object.
2. You must use the given data for visualization.
3. You must use following code block and use additional packages if needed but do not change original import statements.
4. Function name is `main` and it should accept a pandas DataFrame as an argument.

This is the template you should follow:

---
import pandas as pd # DO NOT FORGET TO IMPORT PANDAS

def main(df: pd.DataFrame):
    # Your code here
    return plotly object
---

## Importable libraries:
- pandas
- plotly

But you may have other packages installed in the environment. So you can use other packages if needed.

## Data:
Given sample data is below. You need to use this data as data schema only.
DO NOT write contents of this data to the code. The df is always passed as an argument to the main function.

{data}
""",
        },
        {
            "role": "user",
            "content": prompt,
        },
    ]
    code = ""

    openai_model = OpenAI(api_key=os.getenv("OPENAI_API_KEY"))
    functions = {
        "name": "generate_python_code",
        "description": "Generate python code using plotly for visualization based on user prompt",
        "parameters": {
            "type": "object",
            "properties": {
                "code": {
                    "type": "string",
                    "description": "The python code using plotly generated based on the prompt",
                }
            },
            "required": ["code"],
        },
    }
    response = openai_model.chat.completions.create(
        model="gpt-4o",
        messages=messages,
        functions=[functions],
    )
    code = json.loads(response.choices[0].message.function_call.arguments)["code"]

    code_ = compile(code, "<string>", "exec")
    namespace = {}
    exec(code_, namespace)
    func = namespace["main"]

    fig = func(df)

    yield create_chunk(f"""Successfully, a chart was created!
""", fig.to_html())


