> ## Documentation Index
> Fetch the complete documentation index at: https://docs.morph-data.io/llms.txt
> Use this file to discover all available pages before exploring further.
# PYGWALKERを埋め込んだBIアプリ構築
Morphでは、Pythonのエコシステム上の可視化ライブラリを自由に活用してデータアプリを作ることができます。
このチュートリアルでは、PyGWalkerを使用して作成したリッチなダッシュボードをMorphのデータアプリに埋め込むための方法を紹介します。
## 事前準備
このチュートリアルでは、事前に以下のコマンドを使用してPyGWalkerをインストールしてください。
```bash pip theme={"dark"}
pip install pygwalker
```
```bash poetry theme={"dark"}
poetry add pygwalker
```
```bash uv theme={"dark"}
uv add pygwalker
```
## 最終的な成果物
PyGWalkerは、DataFrame上のデータからインタラクティブにデータ分析を行うためのダッシュボードを作成してくれるライブラリです。
以下のようにMorphのダッシュボード上に配置をしてチームに公開することで簡単にBIアプリを導入することができます。
 ## チュートリアル
このチュートリアルのアプリでは、以下の流れで実装をします。
1. PyGWalkerを使用してHTMLを返却するPythonの関数を作成
2. MDXファイルで``コンポーネントに渡すことで生成されたダッシュボード
``では、HTMLを返却するPython関数をloadDataの対象として受け取った場合にそのHTMLを表示する役割があります。
サンプルデータをDataFrameとして作成をして、そのデータをPyGWalkerを使用してダッシュボードに変換をした上で、HTMLとして返却をします。
```python theme={"dark"}
import pandas as pd
import morph
from morph import MorphGlobalContext
from morph_lib.types import HtmlResponse
import pygwalker as pyg
@morph.func
def create_pygwalker_dashboard(context: MorphGlobalContext):
data = pd.DataFrame({
"city": [
"Los Angeles", "San Francisco", "San Diego", "Sacramento",
"Houston", "Dallas", "Austin", "San Antonio",
"Miami", "Orlando", "Tampa", "Jacksonville",
"New York", "Buffalo", "Rochester", "Syracuse",
"Chicago", "Springfield", "Peoria", "Naperville"
],
"state": [
"California", "California", "California", "California",
"Texas", "Texas", "Texas", "Texas",
"Florida", "Florida", "Florida", "Florida",
"New York", "New York", "New York", "New York",
"Illinois", "Illinois", "Illinois", "Illinois"
],
"population": [
3980400, 883305, 1423851, 508529,
2328000, 1343000, 964300, 1532200,
470914, 285713, 399700, 903889,
8399000, 256304, 206284, 142749,
2716000, 116250, 112936, 147122
]
})
html_code = pyg.to_html(data, appearance="light")
return HtmlResponse(html_code)
```
HTMLとして出力をしたPythonの関数をそのまま``コンポーネントに渡すことでそのままダッシュボードを表示することができます。
```tsx theme={"dark"}
export const title = "Create a dashboard using Pygwalker"
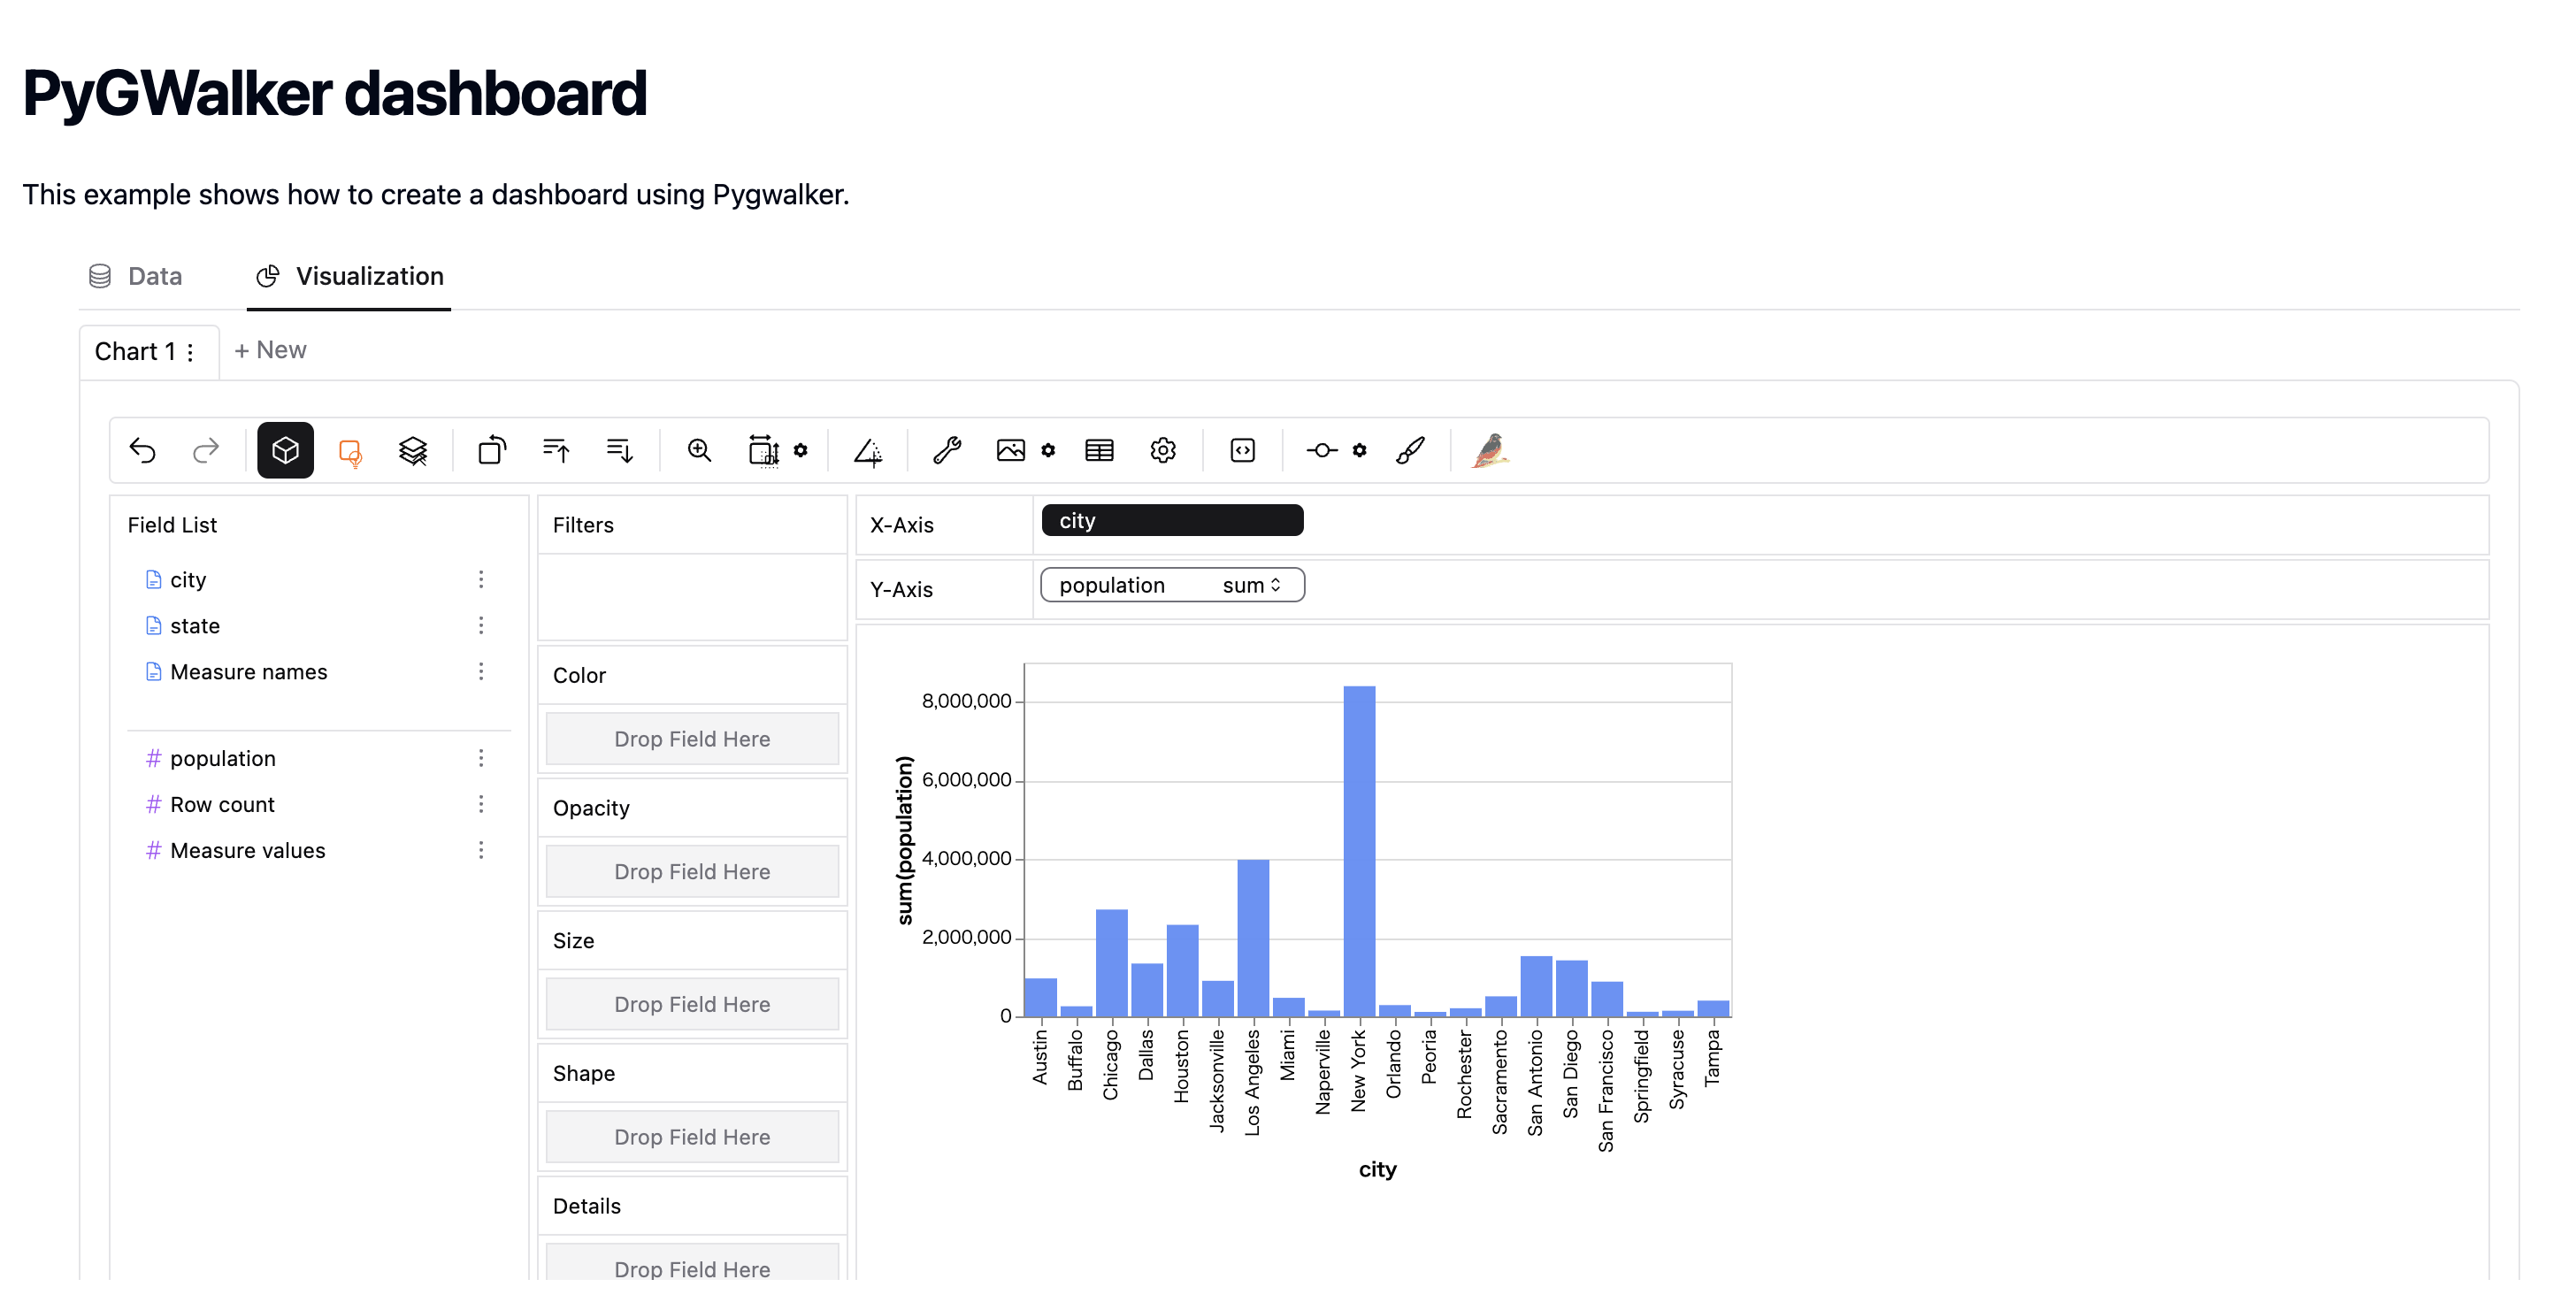
# PyGWalker dashboard
This example shows how to create a dashboard using Pygwalker.
```
## チュートリアル
このチュートリアルのアプリでは、以下の流れで実装をします。
1. PyGWalkerを使用してHTMLを返却するPythonの関数を作成
2. MDXファイルで``コンポーネントに渡すことで生成されたダッシュボード
``では、HTMLを返却するPython関数をloadDataの対象として受け取った場合にそのHTMLを表示する役割があります。
サンプルデータをDataFrameとして作成をして、そのデータをPyGWalkerを使用してダッシュボードに変換をした上で、HTMLとして返却をします。
```python theme={"dark"}
import pandas as pd
import morph
from morph import MorphGlobalContext
from morph_lib.types import HtmlResponse
import pygwalker as pyg
@morph.func
def create_pygwalker_dashboard(context: MorphGlobalContext):
data = pd.DataFrame({
"city": [
"Los Angeles", "San Francisco", "San Diego", "Sacramento",
"Houston", "Dallas", "Austin", "San Antonio",
"Miami", "Orlando", "Tampa", "Jacksonville",
"New York", "Buffalo", "Rochester", "Syracuse",
"Chicago", "Springfield", "Peoria", "Naperville"
],
"state": [
"California", "California", "California", "California",
"Texas", "Texas", "Texas", "Texas",
"Florida", "Florida", "Florida", "Florida",
"New York", "New York", "New York", "New York",
"Illinois", "Illinois", "Illinois", "Illinois"
],
"population": [
3980400, 883305, 1423851, 508529,
2328000, 1343000, 964300, 1532200,
470914, 285713, 399700, 903889,
8399000, 256304, 206284, 142749,
2716000, 116250, 112936, 147122
]
})
html_code = pyg.to_html(data, appearance="light")
return HtmlResponse(html_code)
```
HTMLとして出力をしたPythonの関数をそのまま``コンポーネントに渡すことでそのままダッシュボードを表示することができます。
```tsx theme={"dark"}
export const title = "Create a dashboard using Pygwalker"
# PyGWalker dashboard
This example shows how to create a dashboard using Pygwalker.
```