> ## Documentation Index
> Fetch the complete documentation index at: https://docs.morph-data.io/llms.txt
> Use this file to discover all available pages before exploring further.
# Build a BI app using Pygwalker
Morph allows you to create data apps using visualization libraries within the Python ecosystem.
In this tutorial, we will introduce how to embed a rich dashboard created with PyGWalker into a data app.
## Prerequisites
Please install PyGWalker in advance by the following command.
```bash pip theme={"dark"}
pip install pygwalker
```
```bash poetry theme={"dark"}
poetry add pygwalker
```
```bash uv theme={"dark"}
uv add pygwalker
```
## Output
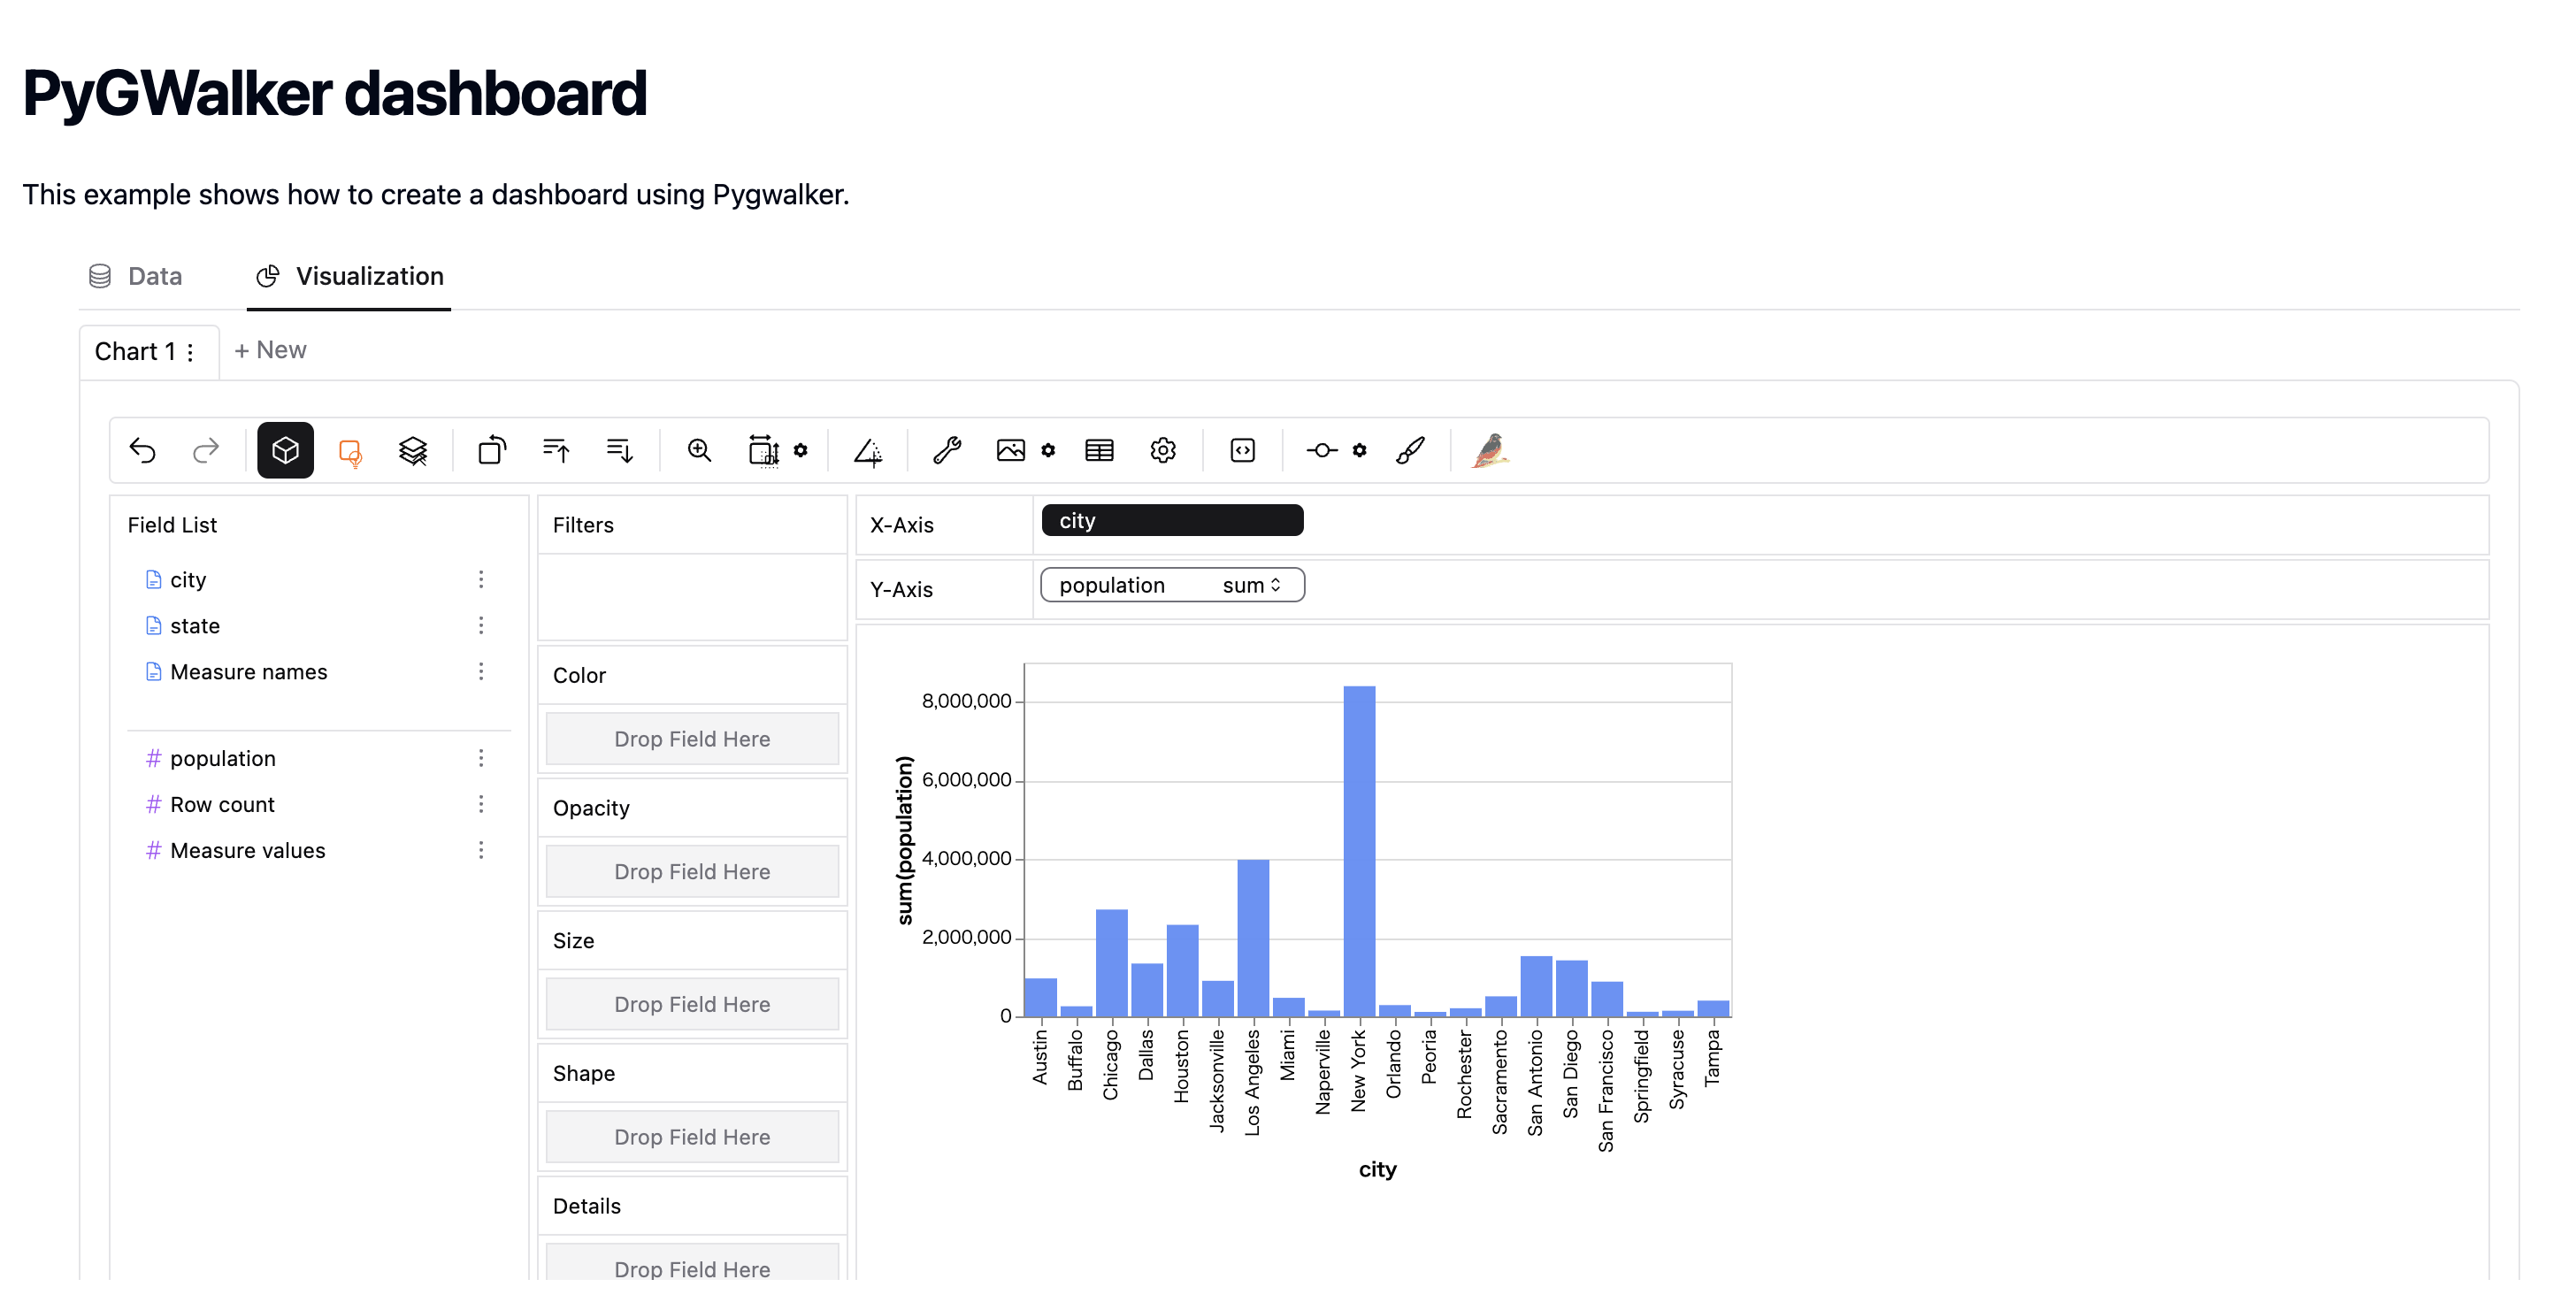
PyGWalker is a library that creates a dashboard for interactive data analysis from data on a DataFrame.
You can easily introduce a BI app by placing it on the data app created by Morph and sharing it with your team.
 ## Tutorial
In this tutorial, we will implement the app in the following steps:
1. Create a Python function that returns HTML using PyGWalker.
2. Pass the created Python function to the `` component in the MDX file to display the dashboard.
`` displays the HTML when a Python function that returns HTML is specified as the target of loadData.
Create sample data as a DataFrame, convert the data to a dashboard using PyGWalker, and return it as HTML.
```python theme={"dark"}
import pandas as pd
import morph
from morph import MorphGlobalContext
from morph_lib.types import HtmlResponse
import pygwalker as pyg
@morph.func
def create_pygwalker_dashboard(context: MorphGlobalContext):
data = pd.DataFrame({
"city": [
"Los Angeles", "San Francisco", "San Diego", "Sacramento",
"Houston", "Dallas", "Austin", "San Antonio",
"Miami", "Orlando", "Tampa", "Jacksonville",
"New York", "Buffalo", "Rochester", "Syracuse",
"Chicago", "Springfield", "Peoria", "Naperville"
],
"state": [
"California", "California", "California", "California",
"Texas", "Texas", "Texas", "Texas",
"Florida", "Florida", "Florida", "Florida",
"New York", "New York", "New York", "New York",
"Illinois", "Illinois", "Illinois", "Illinois"
],
"population": [
3980400, 883305, 1423851, 508529,
2328000, 1343000, 964300, 1532200,
470914, 285713, 399700, 903889,
8399000, 256304, 206284, 142749,
2716000, 116250, 112936, 147122
]
})
html_code = pyg.to_html(data, appearance="light")
return HtmlResponse(html_code)
```
You can display the dashboard as it is by passing the Python function that outputs HTML directly to the `` component.
```tsx theme={"dark"}
export const title = "Create a dashboard using Pygwalker"
# PyGWalker dashboard
This example shows how to create a dashboard using Pygwalker.
```
## Tutorial
In this tutorial, we will implement the app in the following steps:
1. Create a Python function that returns HTML using PyGWalker.
2. Pass the created Python function to the `` component in the MDX file to display the dashboard.
`` displays the HTML when a Python function that returns HTML is specified as the target of loadData.
Create sample data as a DataFrame, convert the data to a dashboard using PyGWalker, and return it as HTML.
```python theme={"dark"}
import pandas as pd
import morph
from morph import MorphGlobalContext
from morph_lib.types import HtmlResponse
import pygwalker as pyg
@morph.func
def create_pygwalker_dashboard(context: MorphGlobalContext):
data = pd.DataFrame({
"city": [
"Los Angeles", "San Francisco", "San Diego", "Sacramento",
"Houston", "Dallas", "Austin", "San Antonio",
"Miami", "Orlando", "Tampa", "Jacksonville",
"New York", "Buffalo", "Rochester", "Syracuse",
"Chicago", "Springfield", "Peoria", "Naperville"
],
"state": [
"California", "California", "California", "California",
"Texas", "Texas", "Texas", "Texas",
"Florida", "Florida", "Florida", "Florida",
"New York", "New York", "New York", "New York",
"Illinois", "Illinois", "Illinois", "Illinois"
],
"population": [
3980400, 883305, 1423851, 508529,
2328000, 1343000, 964300, 1532200,
470914, 285713, 399700, 903889,
8399000, 256304, 206284, 142749,
2716000, 116250, 112936, 147122
]
})
html_code = pyg.to_html(data, appearance="light")
return HtmlResponse(html_code)
```
You can display the dashboard as it is by passing the Python function that outputs HTML directly to the `` component.
```tsx theme={"dark"}
export const title = "Create a dashboard using Pygwalker"
# PyGWalker dashboard
This example shows how to create a dashboard using Pygwalker.
```