> ## Documentation Index
> Fetch the complete documentation index at: https://docs.morph-data.io/llms.txt
> Use this file to discover all available pages before exploring further.
# AI Chat generates and executes code
Morph makes it easy to create AI applications that use LLM to generate code and perform execution results.
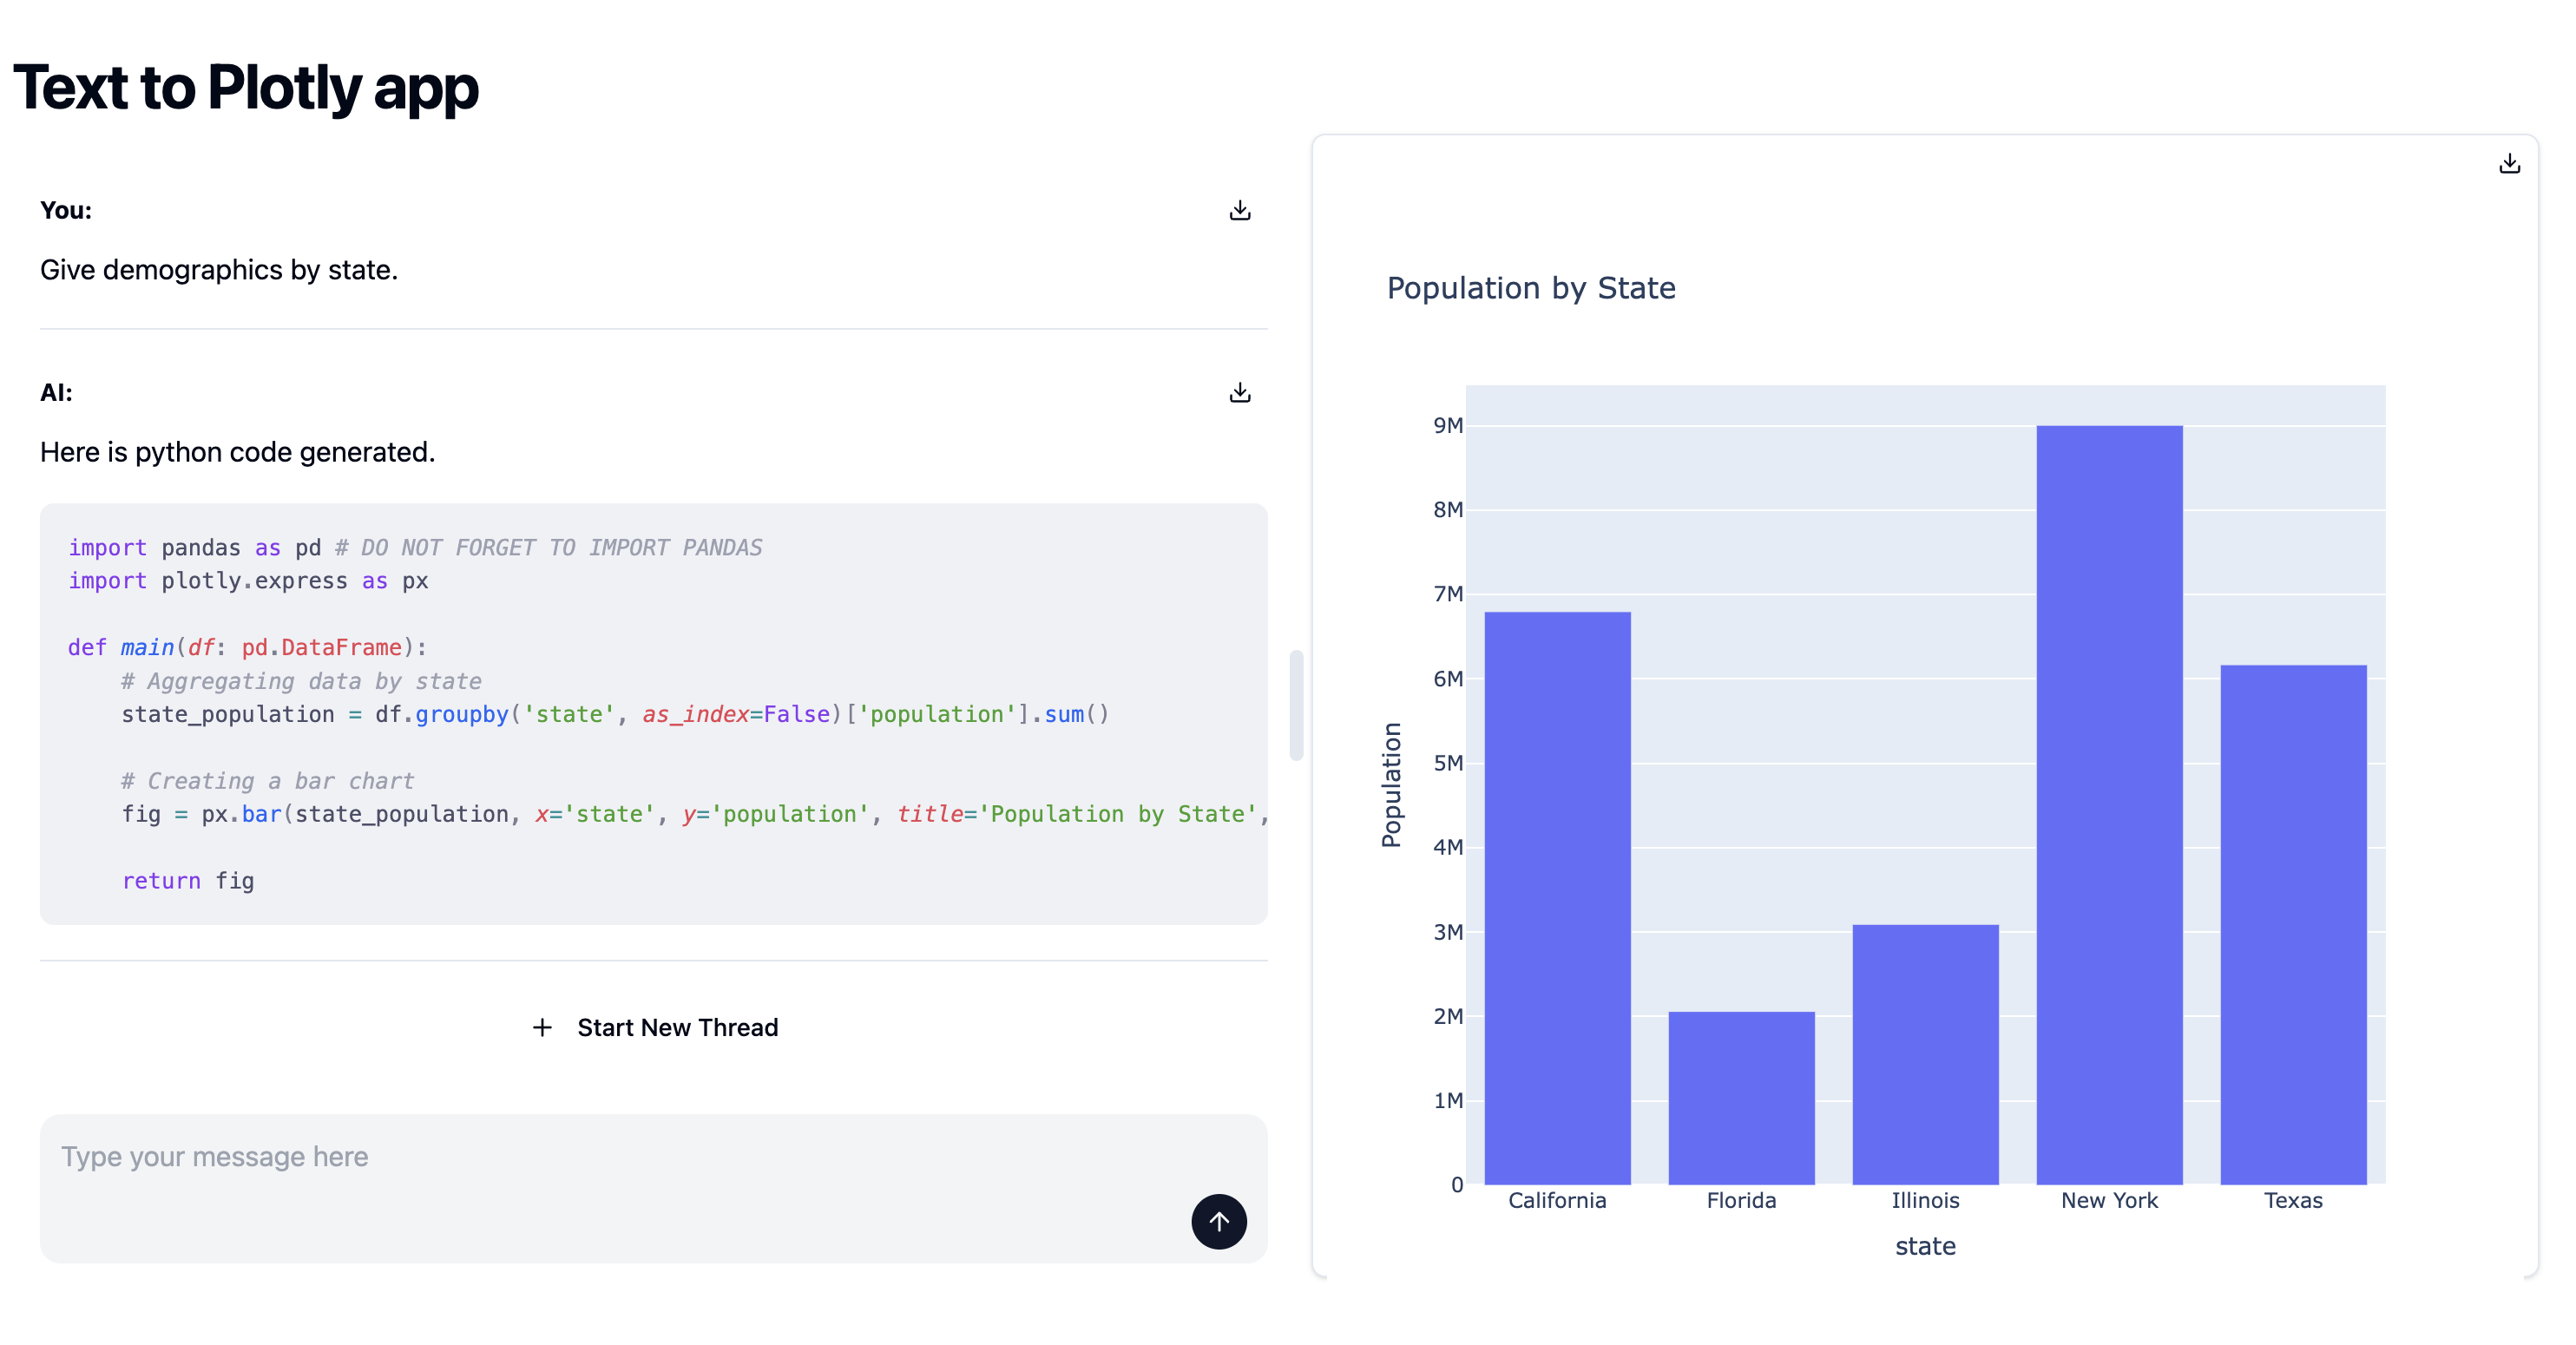
In this tutorial, you will create an application that automatically generates Python code in response to user input and displays the results of the visualisation in real-time.
## Prerequisites
Please install pageckages in advance by the following command.
```bash pip theme={"dark"}
pip install openai plotly
```
```bash poetry theme={"dark"}
poetry add openai plotly
```
```bash uv theme={"dark"}
uv add openai plotly
```
Obtain the OpenAI API key in advance from the OpenAI dashboard and save it in an `.env` file.
```shell .env theme={"dark"}
OPENAI_API_KEY=your_api_key
```
## Output
 ## Tutorial
By specifying `layout="side-by-side"` in the `` component, you can generate code based on user input and display the results in real-time.
Furthermore, the code generation and execution are handled within a Python function using the `text_to_plotly` function, which covers everything from visualization to executing the code.
The `text_to_plotly` function takes a user prompt and a DataFrame as arguments to generate and execute code that performs data analysis using Plotly, according to the user's request.
Additionally, the `side-by-side` layout of the `` component allows the HTML passed as the second argument to the `create_chunk` function to be displayed next to the chat UI, enabling real-time display.
```python theme={"dark"}
import json
import pandas as pd
import os
import morph
from openai import OpenAI
from morph import MorphGlobalContext
from morph_lib.stream import create_chunk
@morph.func
def text_to_plotly_app(context: MorphGlobalContext):
df = pd.DataFrame({
"city": [
"Los Angeles", "San Francisco", "San Diego", "Sacramento",
"Houston", "Dallas", "Austin", "San Antonio",
"Miami", "Orlando", "Tampa", "Jacksonville",
"New York", "Buffalo", "Rochester", "Syracuse",
"Chicago", "Springfield", "Peoria", "Naperville"
],
"state": [
"California", "California", "California", "California",
"Texas", "Texas", "Texas", "Texas",
"Florida", "Florida", "Florida", "Florida",
"New York", "New York", "New York", "New York",
"Illinois", "Illinois", "Illinois", "Illinois"
],
"population": [
3980400, 883305, 1423851, 508529,
2328000, 1343000, 964300, 1532200,
470914, 285713, 399700, 903889,
8399000, 256304, 206284, 142749,
2716000, 116250, 112936, 147122
]
})
prompt = context.vars["prompt"]
data = df.head(5).to_markdown()
messages = [
{
"role": "system",
"content": """You are a great data analyst using python.
You can generate python code based on user prompt and you can use given python libraries.
Please generate python code using plotly or matplotlib for visualization and pandas based on the user's question.
"""},
{
"role": "system",
"content": f"""Generate Python code for visualization using pandas, plotly and you should follow user's question.
Make sure to write `import pandas as pd` at the beginning of the code otherwise the code must throw errors.
## Rules:
1. You must generate Python code using plotly for visualization and the code should return plotly object.
2. You must use the given data for visualization.
3. You must use following code block and use additional packages if needed but do not change original import statements.
4. Function name is `main` and it should accept a pandas DataFrame as an argument.
This is the template you should follow:
---
import pandas as pd # DO NOT FORGET TO IMPORT PANDAS
def main(df: pd.DataFrame):
# Your code here
return plotly object
---
## Importable libraries:
- pandas
- plotly
But you may have other packages installed in the environment. So you can use other packages if needed.
## Data:
Given sample data is below. You need to use this data as data schema only.
DO NOT write contents of this data to the code. The df is always passed as an argument to the main function.
{data}
""",
},
{
"role": "user",
"content": prompt,
},
]
code = ""
openai_model = OpenAI(api_key=os.getenv("OPENAI_API_KEY"))
functions = {
"name": "generate_python_code",
"description": "Generate python code using plotly for visualization based on user prompt",
"parameters": {
"type": "object",
"properties": {
"code": {
"type": "string",
"description": "The python code using plotly generated based on the prompt",
}
},
"required": ["code"],
},
}
response = openai_model.chat.completions.create(
model="gpt-4o",
messages=messages,
functions=[functions],
)
code = json.loads(response.choices[0].message.function_call.arguments)["code"]
code_ = compile(code, "", "exec")
namespace = {}
exec(code_, namespace)
func = namespace["main"]
fig = func(df)
yield create_chunk(f"""Successfully, a chart was created!
""", fig.to_html())
```
Specify the Python function in the `postData` attribute of the `` component.
By specifying `layout="side-by-side"`, the visualization results will be displayed in real-time.
```tsx theme={"dark"}
export const title = "Text to Plotly app"
# Text to Plotly app
```
## Tutorial
By specifying `layout="side-by-side"` in the `` component, you can generate code based on user input and display the results in real-time.
Furthermore, the code generation and execution are handled within a Python function using the `text_to_plotly` function, which covers everything from visualization to executing the code.
The `text_to_plotly` function takes a user prompt and a DataFrame as arguments to generate and execute code that performs data analysis using Plotly, according to the user's request.
Additionally, the `side-by-side` layout of the `` component allows the HTML passed as the second argument to the `create_chunk` function to be displayed next to the chat UI, enabling real-time display.
```python theme={"dark"}
import json
import pandas as pd
import os
import morph
from openai import OpenAI
from morph import MorphGlobalContext
from morph_lib.stream import create_chunk
@morph.func
def text_to_plotly_app(context: MorphGlobalContext):
df = pd.DataFrame({
"city": [
"Los Angeles", "San Francisco", "San Diego", "Sacramento",
"Houston", "Dallas", "Austin", "San Antonio",
"Miami", "Orlando", "Tampa", "Jacksonville",
"New York", "Buffalo", "Rochester", "Syracuse",
"Chicago", "Springfield", "Peoria", "Naperville"
],
"state": [
"California", "California", "California", "California",
"Texas", "Texas", "Texas", "Texas",
"Florida", "Florida", "Florida", "Florida",
"New York", "New York", "New York", "New York",
"Illinois", "Illinois", "Illinois", "Illinois"
],
"population": [
3980400, 883305, 1423851, 508529,
2328000, 1343000, 964300, 1532200,
470914, 285713, 399700, 903889,
8399000, 256304, 206284, 142749,
2716000, 116250, 112936, 147122
]
})
prompt = context.vars["prompt"]
data = df.head(5).to_markdown()
messages = [
{
"role": "system",
"content": """You are a great data analyst using python.
You can generate python code based on user prompt and you can use given python libraries.
Please generate python code using plotly or matplotlib for visualization and pandas based on the user's question.
"""},
{
"role": "system",
"content": f"""Generate Python code for visualization using pandas, plotly and you should follow user's question.
Make sure to write `import pandas as pd` at the beginning of the code otherwise the code must throw errors.
## Rules:
1. You must generate Python code using plotly for visualization and the code should return plotly object.
2. You must use the given data for visualization.
3. You must use following code block and use additional packages if needed but do not change original import statements.
4. Function name is `main` and it should accept a pandas DataFrame as an argument.
This is the template you should follow:
---
import pandas as pd # DO NOT FORGET TO IMPORT PANDAS
def main(df: pd.DataFrame):
# Your code here
return plotly object
---
## Importable libraries:
- pandas
- plotly
But you may have other packages installed in the environment. So you can use other packages if needed.
## Data:
Given sample data is below. You need to use this data as data schema only.
DO NOT write contents of this data to the code. The df is always passed as an argument to the main function.
{data}
""",
},
{
"role": "user",
"content": prompt,
},
]
code = ""
openai_model = OpenAI(api_key=os.getenv("OPENAI_API_KEY"))
functions = {
"name": "generate_python_code",
"description": "Generate python code using plotly for visualization based on user prompt",
"parameters": {
"type": "object",
"properties": {
"code": {
"type": "string",
"description": "The python code using plotly generated based on the prompt",
}
},
"required": ["code"],
},
}
response = openai_model.chat.completions.create(
model="gpt-4o",
messages=messages,
functions=[functions],
)
code = json.loads(response.choices[0].message.function_call.arguments)["code"]
code_ = compile(code, "", "exec")
namespace = {}
exec(code_, namespace)
func = namespace["main"]
fig = func(df)
yield create_chunk(f"""Successfully, a chart was created!
""", fig.to_html())
```
Specify the Python function in the `postData` attribute of the `` component.
By specifying `layout="side-by-side"`, the visualization results will be displayed in real-time.
```tsx theme={"dark"}
export const title = "Text to Plotly app"
# Text to Plotly app
```